


Abstract
Biological markers in nasal secretions provide valuable information on nasal pathophysiology. However, published data on biomarker concentrations in nasal fluids are remarkably inconsistent, and the bias due to different sampling techniques, has not yet been systematically evaluated.
Concentrations of various protein were repeatedly determined in nasal secretions of 16 healthy volunteers. The proteins were detected by using: 1) α2-macroglobulin as a marker for plasma contamination; 2) lactoferrin as a marker for glandular secretion; 3) lactate dehydrogenase as a marker for tissue injury; and 4) interleukin (IL)-1β, IL-8, tumour necrosis factor-α, and eosinophil cationic protein and tryptase as indicators for tissue inflammation. A total of four different sampling methods, including nasal lavage (NL) and a new polyurethane foam sampler technique (PFST) were employed.
Analyte concentrations in NL were approximately10-times lower than in specimens obtained by PFST. Due to the unpredictable dilution during NL, various analytes were below the detection limit of the high sensitivity assays employed. With PFST, concentrations below the detection limit rarely occurred. The specimens did not significantly differ regarding plasma contamination, glandular secretion or tissue injury.
The considerable variability of reported analyte concentrations in nasal secretions mainly results from different sampling techniques. To collect nasal secretions, samplers are considered superior to nasal lavage techniques.
This research was supported by a grant from the State of Baden-Württemberg, BWPLUS L98 002, Germany.
In recent years, investigations on upper airway mucosa inflammation, e.g. in response to inoculation with bacterial or viral pathogens 1–3, allergen challenge 4–6, or exposure to environmental pollutants 7–9, have focused on the detection of minute amounts of cytokines and inflammatory mediators. For this purpose, various methods to collect nasal secretions are employed (table 1⇓), yielding heterogeneous matrices and analyte concentrations. As a consequence, widely diverging analyte concentrations are frequently reported rendering comparison of results difficult.
Common techniques used to sample nasal secretions
Current sampling techniques can be categorised in collection of spontaneous secretions, dilution techniques and absorption techniques (table 1⇑). Collection of spontaneous secretions is practicable in patients with nasal hypersecretion as a result of nasal disease 10, 11. However, in healthy individuals the amount of spontaneously secreted or expulsed fluid from the nose is often insufficient for common, investigative techniques 12.
In dilution techniques, a liquid is instilled into the nose, recovered with an admixed and sample of epithelial lining fluid 13, 14. The dilution technique most commonly applied is nasal lavage 13. Since unknown fractions of the lavage fluid may be swallowed or absorbed, these techniques are associated with a substantial, often unpredictable, dilution of the nasal secretion 11. As a consequence, the concentrations of analytes may reveal high variability and frequently fall below the lower detection limits of the assays applied 12.
An alternative technique in the collection of nasal epithelial lining fluid involves the use of a sampler with absorptive properties which is placed within the nasal cavity. The absorption technique overcomes the problem encountered when only small quantities of spontaneous secretions are available, as it provides sufficient amounts of undiluted nasal secretions to enable various laboratory investigations to be undertaken 15. However, these techniques have been thought to traumatise the nasal mucosa and therefore alter the concentration of biomarkers under investigation.
In this study, the influence of four sampling techniques on several analytes in nasal secretions of healthy volunteers were explored, including nasal lavage (NL), a nasal spray-blow technique (NSB), a filter paper method (FPM), and a polyurethane foam sampler technique (PFST). Total protein (TP), α2-macroglobulin (A2M) as a marker of blood plasma contamination 16, lactate dehydrogenase (LDH) as a marker of tissue injury, lactoferrin (LTF) as a marker of glandular secretion 17, 18 and interleukin (IL)-1β, IL-8, tumour necrosis factor (TNF)-α, eosinophil cationic protein (ECP), and tryptase (TRP) as commonly employed markers of airway inflammation were assessed. The following questions were addressed, in detail, in this study: 1) which method provides sufficient specimen volume for the assays intended; 2) how frequent are samples with analyte concentrations below the detection limit of the assay; 3) how is the inter-individual variability and intra-individual variability of repeated measurements within 1 day; and 4) are there indicators for mucosal trauma or specific alterations of the composition of obtained secretions depending on the collection technique.
Methods
Study population
After approval from the investigational review board, 16 healthy, nonsmoking, nonallergic volunteers aged 18–60 yrs, without acute or chronic nasal disorders or any nasal medication for the previous 6 weeks prior to the study were included. A detailed questionnaire, anterior and posterior rhinoscopy, and skin-prick tests with inhalation allergens, common in central Europe, were performed in all participants.
Sampling techniques
A total of four sampling techniques were employed; NL, NSB, FPM and PFST. The volunteers were acclimatised to the indoor conditions and their noses were cleaned of any excess mucus. No nasal decongestants, anaesthetics or prewashes were applied.
For NL each nostril was washed with 5 mL isotonic sodium chloride solution. Volunteers tilted their head back at a 45° angle and closed the nasopharynx with the soft palate. After 10 s, the volunteer blew their nose forcefully onto a glass dish. For NSB technique isotonic saline solution was applied with a pump metered-dose dispenser (Allergopharma, Reinbek, Germany) to the sitting volunteer. A 400 µL aliquot was delivered into each nostril. The volunteer was asked to stop breathing during application. Following a 20-s period after the application, the volunteer blew their nose forcefully onto a glass dish. The sample was washed from the dish into a centrifuge tube with 1 mL isotonic saline solution. For FPM white filter paper stripes (40×10×0.37 mm, GB 002, 195 g·m−2; Schleicher & Schüll, Dassel, Germany) were placed in the middle portion of the nasal septum, posterior to the mucocutaneous junction of each nasal cavity. The filters were removed after a 10-min period and placed on the piston of a syringe in a centrifuge tube (Labcon, San Raphael, CA, USA), and the fluid was separated from the strips by centrifugation (5 min, 500×g, 4°C). The pellet without the basal cell layer was further processed. For PFST, open cell flexible polyurethane foam with a specific weight of 30 kg·m−3 (ISO 5999, 1982) was cut by the local distributor in squares of 28×18×6 mm. The fluid retention capacity of one sampler is ∼2.5 mL. Samplers were placed into each nasal cavity posterior to the mucocutaneous junction under direct visualisation and left in place for 10 min. Following removal, the fluid was extracted from the sampler by centrifugation as described earlier.
Handling and storage
Immediately following harvest the secretions were placed on ice. Cellular elements were instantly separated from the liquid phase by centrifugation at 500×g for 5 min at 4°C and further processed. The cell-free supernatants were then homogenised by ultrasonication at 160 Watts for 5 min (Sonorex RK 100 SH, Bandelin electronic Ltd, Berlin, Germany). The amount of fluid obtained was measured volumetrically. Then, aliquots of 100 µL of the homogenised fluids were stored at −20°C for further processing.
Sampling schedule
Each sampling technique was performed in each subject three times on each examination day (08:00, 08:30 and 16:00 h). Between each examination day, 2 days were left to minimise carry over effects between the different sampling techniques. Moreover, the sequence of sampling techniques followed a complete Latin square design.
Determination of biomarkers
The concentrations of all substances were determined in duplicate and calculated as the actual concentrations in the undiluted specimen, as it had been obtained, by each sampling technique. The specimens were diluted to adapt to the working range of the various assays according to previous checkerboard titrations (table 2⇓). Immunoassays were performed with the microplate reader MRX employing the software Biolinx (Dynatech Ltd, Denkendorf, Germany).
Fluid volume needed for a single test, lower detection limits and specimen dilution for each assay employed
TP concentration were assessed by using the Bradford protein assay (Bio-Rad Laboratories GmbH, Munich, Germany). A2M was measured by a competitive time-resolved fluorescence-immunoassay using anti-A2M-coated microtitre plates and Europium-labelled human A2M. A2M was labelled with Europium using the DELFIA® EU-labelling kit (1244-302; Wallac Oy, Turku, Finland). LDH was measured using a nonradioactive kit (Promega, Madison, WI, USA). LTF was assessed with a biotin-avidin amplified enzyme-linked immunoassay (Oxis Int. Inc., Portland, OR, USA). For determination of IL-1β, IL-8 and TNF-α Quantikine or Quantikine HS Immunoassays (R&D Systems, Wiesbaden-Nordenstedt, Germany) were employed. ECP and TRP were measured with a matrix bound time-resolved fluorescence assay (UniCAP; Pharmacia, Freiburg, Germany). The amount of substrate needed for each assay, the lower detection limits and the employed dilution factors are given in table 2⇑.
Statistics
For each sampling method and biomarker, specimens with detectable concentrations were counted. The mean±sd and additional parameters were calculated from specimens with measurable analyte concentrations. Distributions of actual and logarithmically transformed analyte concentrations were explored graphically and with the Kolmogorov Smirnov test. For each sampling method, the inter-individual coefficient of variation (CV) was calculated in per cent and the intra-subject coefficients of the variation of the three samples obtained at 08:00, 08:30 and 16:00 h within 1 day were computed.
Partial correlations were performed after regression of each variable on the four sampling methods employed. Depending on the distribution and homogeneity of variance, differences between biomarker concentrations obtained with the four sampling techniques were explored with one-way analysis of variance or the Friedman test. Statistical calculations were performed using Systat® (Evanston, IL, USA).
Results
For all sampling methods used, the participants described the collection of nasal secretions as slightly uncomfortable, but well tolerable. One specimen (one NL at the third time point) was lost. The number of samples with analyte concentrations that were greater than the lowest detection limit of each assay are presented in table 3⇓. The mean±sd of each biomarker obtained with the four sampling techniques are outlined in table 4⇓. Sampling fluid was obtained on all occasions with NL, NSB, and PFST. With FPM, no fluid (dry sample) was obtained in 10 cases. The collected volumes revealed an irregular distribution. The amount of obtained fluid differed extensively with the four collection methods applied (table 4⇓).
Number of specimens with analyte concentration above the lower detection threshold of the assay used
The fluid volume and analyte concentrations obtained by the four sampling techniques employed
TP was log-normally distributed (p>0.7 for each method, fig. 1⇓). The inter-individual CV ranged between 80–90% for all sampling methods employed. TP at the three sampling times within 1 day revealed a similar pattern with all four sampling techniques employed. The protein concentrations dropped to ∼60%, 30 min after the initial sampling and reached the initial values again after 8 h (fig. 2⇓). The mean intra-individual coefficient of variation of TP collected with the four sampling techniques within the same day was 43% for NLT, 48% for NSB, 34% for FPM and 39% for PFST.
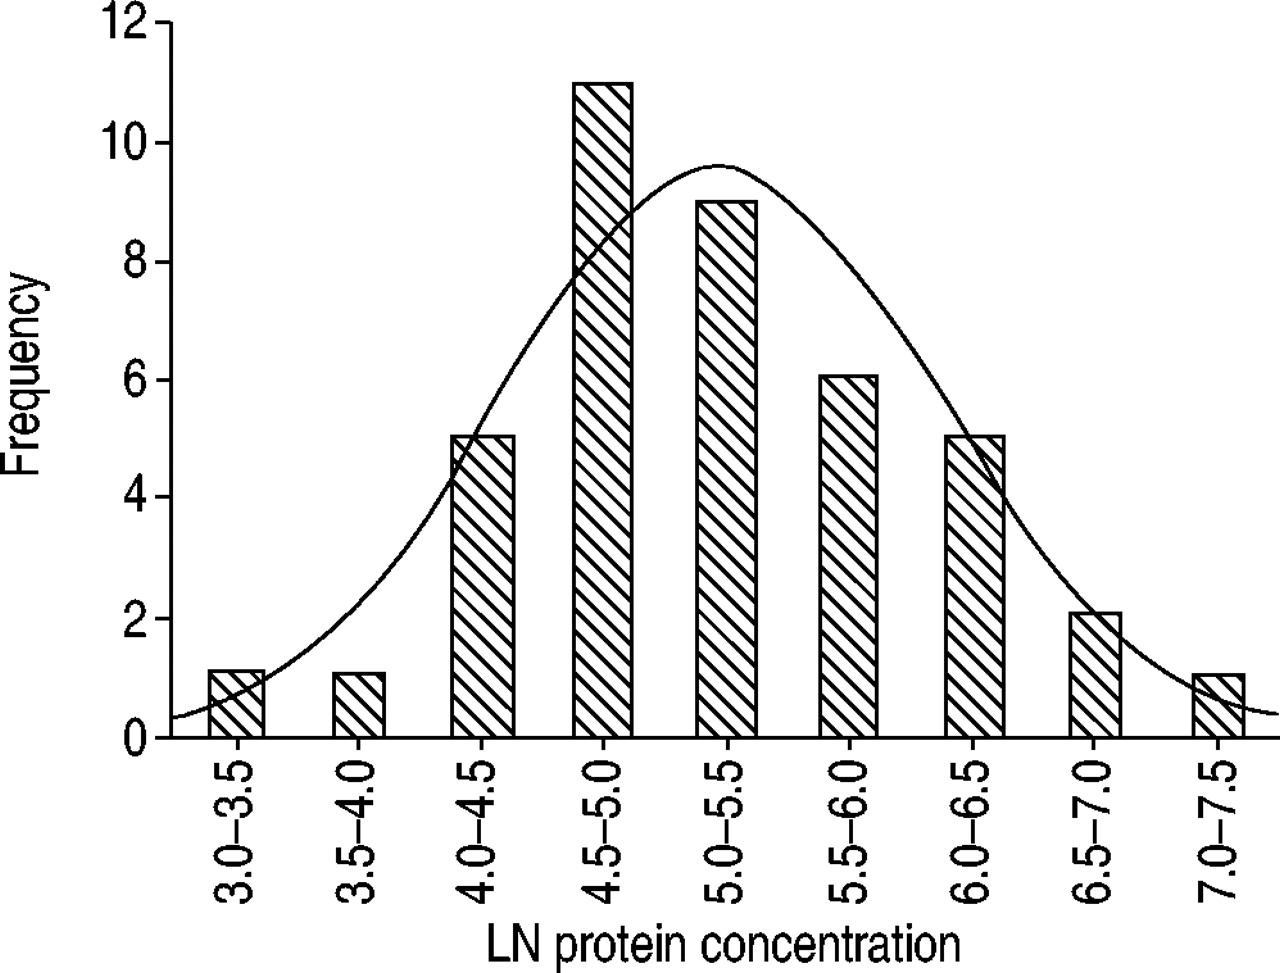
Natural logarithm (LN) of protein concentration in 41 nasal lavages of healthy volunteers revealing log-normal distribution. Log-normal distribution (–) was observed for total protein, lactoferrin, interleukin (IL)-β, IL-8 and tumour necrosis factor-α for all sampling techniques employed.

Total protein concentrations in nasal secretions obtained at T1: 08:00 h; T2 08:30 h and T3:16:00 h, in 16 healthy volunteers by using four different sampling techniques as a fraction of the concentration obtained at the initial sampling. •: nasal lavage; ♦: nasal spray blow technique. ▴: filter paper method; ▪ polyurethane foam sampler technique A similar time course of analyte concentrations was found with lactoferrin, interleukin (IL)-1β, IL-8, tumour necrosis factor-α, and eosinophil cationic protein.
A2M was detected in eight of 30 NL, one of 12 NSB, four of seven FPM and one of nine PFST. In the eight NL with detectable amounts, A2M averaged at 144±280 µg·mL−1, in the one NSB it was 2.6 µg·mL−1, in the four FPM it was 71±43 µg·mL−1and in the one PFST it was 20.3 µg·mL−1. LDH was detected in five of 30 NL, 0 of 12 NSB, 0 of seven PDM, and one of nine PFST. In the five NL samples with measurable concentrations, LDH averaged at 6.3±7.8 mU·L−1, in the one PFST sample it was 0.6 mU·L−1. LTF was detectable in all specimens. The concentration of LTF revealed a log-normal distribution (p>0.7). The inter-individual CV was 27% with NL, 50% with NSB, 43% with FPM and 19% with PFST. The intra-subject CV was in the range of 40–60% with all four sampling methods evaluated.
IL-1β was log-normally distributed (p>0.8) and differed widely between the four sampling techniques employed (table 4⇑). The time/course of IL-1β concentrations was similar to that of the total protein. The mean intra-subject CV was 54% with NL, 59% with NSB, 52% with FPM and 44% with PFST. IL-8 was detectable in almost all specimens (table 3⇑). The concentrations of IL-8 obtained from the four sampling methods were log-normally distributed. The inter-indivdual CV was 110% for NL and NSB, 85% for FPM and 70% for PFST, respectively. The time/course of IL-8 concentrations obtained at the three sampling times within 1 day was similar to that of total protein. The intra-subject CV was 65% with NL, 67% with NSB, 42% with FPM and 43% with PFST. Excluding the influence of the collection method by partial correlation analysis, logarithms of IL-8 concentrations correlated with logarithms of IL-1β levels (r=0.66, p<0.01). This correlation became particularly remarkable with PFST alone (r=0.83, p<0.01, fig. 3⇓). TNF-α was frequently below the detection limit (table 3⇑). Data for the time/course of TNF-α concentrations are available for NL (30% of initial values at 08:30 h and 55% at 16:00 h) and NSB (55% of initial values at 8:30 h and 60% at 16:00 h). Intra-subject variation for NL was 49% and NSB 34%. ECP concentrations revealed an irregular distribution. It was detected in most specimens obtained (table 3⇑). The inter-individual CV was 127% with NL, 145% with NSB, 81% with FPM and 118% with PFST. The time/course of ECP concentrations was similar to that of LTF. The intra-subject coefficient of variation was 40% for NL, 58% for NSB, 63% for FPM, and 47% for PFST. Logarithms of ECP-concentrations correlated with the logarithms of IL-1β (r=0.57, p<0.01) and IL-8 concentrations (r=0.53, p<0.01). In the specimens with detectable TRP concentrations, levels averaged at 5.6+4.9 ng·mL−1 in NL, 5.3±3.7 mL−1 in NSB, 37.6±31.4 mL−1 in FPM and 40.0±48.0 mL−1 in PFST. Data obtained did not provide information on inter-individual or intra-subject coefficient of variation. Logarithms of tryptase levels obtained with the various sampling techniques correlated with logarithms of ECP-levels (r=0.72, p<0.005).

Correlation of the natural logarithms (LN) of interleukin (IL)-1β and IL-8 concentrations in nasal secretions of healthy volunteers. A close correlation was also found with tumour necrosis factor-α, and eosinophil cationic protein, suggesting that inter-individual differences in the expression of several biomarkers are in part due to a clinically unapparent immunologic response.
Discussion
Nasal secretions are inhomogeneous fluids revealing considerable intra- and inter-individual variations in amount, composition, physical properties, biological activity and cellular content 19. These characteristics may change rapidly in response to various stimuli. Moreover, nasal secretions reveal spontaneous diurnal fluctuations 20, 21. Airway epithelial lining fluids derive from four major sources, i.e. goblet cells, submucous glands, transepithelial ion and water transport, and plasma transudation 22. In the nose, lacrimal fluid and water condenses at the mucosal surface during expiration can make an additional contribution 23. Nasal secretions contain minute amounts of cytokines and other inflammatory mediators expressed by various epithelial and nonepithelial cells 1, 10, 24, 25. Because cytokines play a dominant role in the pathophysiology of airway disease, interest has focused on cytokine determinations in nasal secretions. Data on cytokine concentration obtained with different sampling techniques may differ by more than an order of magnitude. Moreover, missing data due to cytokine concentrations below the detection threshold of the assays in control groups or at baseline investigations are a common problem 12, 15.
In this study, four sampling techniques were compared with regard to reliability of detection, mean values, and variability of IL-1, IL-8 and TNF-α, ECP and tryptase in healthy unchallenged volunteers. To assess the effects of repeated samplings, nasal secretions were collected in each subject at 08:00, 08:30 and 16:00 h with the same technique. In addition to the biomarkers of interest, LDH was assessed as an indicator of cell damage, A2M as an indicator of vascular leakage 6, and LTF was included as a marker of glandular secretion 17, 18. However, the study was carried out without any form of nasal provocation. Therefore, comparisons on how reproducible the different methods are with respect to differing amounts of nasal secretions e.g. a strong increase after an allergen challenge, cannot be evaluated.
Although sufficient amounts of sampling fluid were obtained with all NL, analyte concentrations were below the detection limit of 35% of the highly sensitive assays used. To overcome the problem of low analyte concentrations, nasal lavages can be concentrated using various techniques 5, 26. However, these techniques are associated with several disadvantages 27. For NL, participants had to be trained to acquire comparable recoveries and the intricate handling renders this method difficult for field studies. The FPM yielded dry specimens in 10 of 48 samples. These two techniques are considered less suitable for cytokine determinations when normal controls are included in the evaluation. NSB yielded sufficient specimen amounts in all participants, however, analyte concentrations were below the detection limit in 21% specimens. In this investigation, PFST was superior to the other sampling techniques. In one sample, an insufficient amount of sampling fluid was obtained. Despite the supposed mucosal trauma induced by the sampler, A2M and LDH were more frequently detected in NL than in PFST, suggesting that plasma transudation and tissue trauma does not disproportionately interfere with the results of PFST. Further advantages of PFST are easy handling, comparatively small variability and minor cooperation required by the examinee.
In nasal secretions, some proteins are found in concentrations considerably higher than in blood plasma. IL-8 was found in nasal secretions in concentrations 10–100 times higher than in human sera 28. Unless the samples of FPM or PFST are diluted to adapt to the working range of the assay, falsely low IL-8 levels may be measured (fig. 4⇓). Possible causes for this matrix phenomenon include decreased accessibility to the immobilised antibody due to space occupying molecules and unspecific binding of competing molecules present in high concentrations 29. If the cytokine concentration in nasal secretions is not known in advance, it is advisable to perform checkerboard titrations to adapt to the working range of the assay.

Checkerboard titration of interleukin (IL)-8 determinates with an enzyme immunoassay indicating that matrix effects may yield falsely low results if nasal sample fluids are not adapted to the working range of the assay. For IL-8 determinations a 1:10 or 1:20 dilution seemed appropriate for the assay employed.
Analyte concentrations obtained by all four sampling techniques revealed a log-normal distribution. The inter-individual CV ranged between 10% and 120% with slightly lower variability, when absorption techniques were employed. The observed correlation of analyte concentrations suggest that this variability is in part due to individual differences in biomarker expression, possibly in response to the various stimuli the participants were exposed to during the study period. The inter-assay CV of the assays ranged between 10–20% as reported by the manufacturers and contributed to this variability. However, the CVs were substantially reduced to between 5–15% when the logarithms of analyte concentrations were calculated. The intrasubject CVs ranged between 40–80% and were biased by consistently lower concentrations obtained at the second sampling 30 min after the initial sampling. Apparently, the loss of analytes in the nasal epithelial lining fluid had not been compensated for within the 30 min interval. Again, CVs were substantially reduced, when logarithms were evaluated. It did not reduce the variability when cytokine concentrations were expressed as a fraction of total protein and this was found to be consistent with the results obtained by Noah et al. 3.
The detection of cytokines and other inflammatory mediators in nasal secretions of healthy, nonallergic and nonsmoking volunteers is consistent with current evidence on airway epithelial cell cytokine expression 30, 31. Interleukin-1β and tumour necrosis factor-α are constitutively produced at low levels, whereas interleukin-6 and particularly interleukin-8 are secreted in high concentrations. Eosinophil cationic protein is detectable in low concentrations also in normal nonallergic individuals, whereas tryptase was rarely detected. The pattern of cytokines assessed in this study suggests that the epithelial layer is the main source of protein in the four sampling techniques employed.
- Received August 8, 2002.
- Accepted November 14, 2002.
- © ERS Journals Ltd
References


